It would be safe to say that Americans are presently living in a state of anxiety and fear. I am admittedly far from immune to this from my end- on behalf of my entire household and family (and, incidentally, myself). However, it is worthwhile to step back a bit (in many ways) and tackle this- as mathematicians do- from a mathematical perspective.
Perhaps then, the conflicting news reports will begin to make some sense.
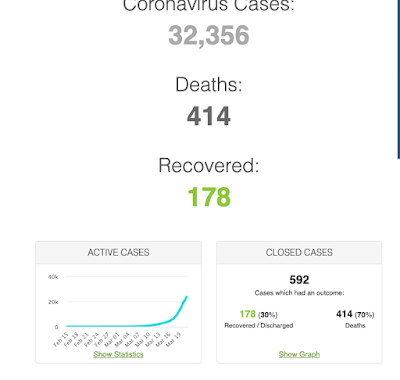
This is the current U.S. data on Coronovirus numbers. This virus- as with any virus - can be modeled as a logistic growth function. A logistic growth function is most commonly used in biology, as any population will initially grow exponentially, but the rate of increase will slow, eventually to 0; at that point, we reach the "carrying capacity." In the case of viruses, that "carrying capacity" would actually be the total number of people infected. After all, viruses needed human hosts to remain "alive" (insofar as viruses are technically not considered alive); once there are no further non-immune hosts available, they would theoretically cease to operate- so to speak. Any physicians reading this are probably cringing at my medical terminology (or lack thereof). Back to the math....
So what is a logistic growth function?
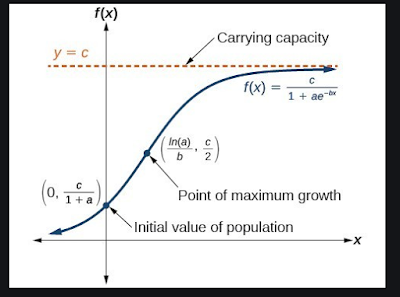
And right now, we are still on the first half (or leg, if you prefer) of the graph, during which dP/dT, the rate of increase, is still increasing. As of today, Coronovirus cases are increasing at a rate of 7500 per day. The "inflection point" would represent the midway point of this crisis. At that inflection point, the rate of increase would stabilize, and the daily rate of new cases would begin to decrease. You see, then, that even if today is the inflection point (which seems unlikely), we would still have another 3 weeks until the graph finally plateaued, and the total Coronavirus cases in our country maxed out at 65,000, with the virus declared contained at that point. That would appear be the best case scenario as of this point. Until we actually reach that inflection point, we would extend our estimate of the crisis' duration, as well as the maximum expected number of Coronavirus cases.
UPDATED 3/26/2020- The number of Coronavirus cases in the U.S. is now 85,268, with dP/dT of over 17,000 and climbing. We are poised to reach P of 100,000 within hours. The function now resembles an exponential function of the form P = P0r^t, where r is between 1.2 and 1.25. We are evidently not approaching an inflection point. Prepare for reported Coronavirus cases to exceed 200,000 in the best-case scenario. Worst case, we may conceivably head into 7 figures.
This happens normally, by the way- with colds, etc. We hear the expression "There's a cold going around." Within a few weeks, much of the population is infected. Why? Because normally we do not shut the country. Colds are normally of minimal danger (aside from for those with severe immune deficiencies); hence, there is no reason to stop business as usual. However, this virus is different. It is far nastier, and with a mortality rate of 4%, allowing 1/2 the population to become infected (which is a figure we hear commonly) in the absence of a shutdown, amounting to roughly 10 million American deaths, would be unacceptable to us.
We hear the expression "flattening the curve." This is precisely what is accomplished by this shutdown. Minimizing human interaction (aka “social distancing”) slows the rate of transmission so that the maximum number of Coronacases- and, more importantly, deaths resulting from such, is minimized. There is a price paid, however- increased duration. To save lives, this shutdown increases the duration before the "carrying capacity" point is reached. Hopefully we all would concur that increasing the duration is worth saving many millions of lives. Also, we hear about hospitals' capacity. By slowing the spread, this also - hopefully- decreases the cases of severe Coronavirus patients who are unable to receive adequate treatment due to shortages of beds, medical supplies, etc.
We hear many officials indicating figures of 9-11 more weeks. This is a probably fairly accurate estimate of the time remaining until containment is attained. One official grimly indicated 18 months, punctuated by multiple waves. This would make sense when considering the expectation that a vaccine to eliminate COVID-19 would likely take 18 months to develop, and meanwhile- even after containment is achieved- some people might potentially bring the virus back into our country, and it would then resume spreading to Americans not previously infected, and then another round of this. Hopefully, with our government wiser from the experience, the response would be more prompt, decisive, and hence more effective than this round.
And this, in a nutshell, is the mathematical representation of the Coronavirus pandemic. If you prefer to hear the non-mathematical details- regarding food shortages, people acting irrationally, the occasional touching story of people reaching out to help others, etc., this will pop up in front of you in today's headlines. No reason for me to provide more of this here. However, if you are reading this, please stay safe. And as Mr. Spock would say, "Live long and prosper!"
 This is the current U.S. data on Coronovirus numbers. This virus- as with any virus - can be modeled as a logistic growth function. A logistic growth function is most commonly used in biology, as any population will initially grow exponentially, but the rate of increase will slow, eventually to 0; at that point, we reach the "carrying capacity." In the case of viruses, that "carrying capacity" would actually be the total number of people infected. After all, viruses needed human hosts to remain "alive" (insofar as viruses are technically not considered alive); once there are no further non-immune hosts available, they would theoretically cease to operate- so to speak. Any physicians reading this are probably cringing at my medical terminology (or lack thereof). Back to the math....
So what is a logistic growth function?
This is the current U.S. data on Coronovirus numbers. This virus- as with any virus - can be modeled as a logistic growth function. A logistic growth function is most commonly used in biology, as any population will initially grow exponentially, but the rate of increase will slow, eventually to 0; at that point, we reach the "carrying capacity." In the case of viruses, that "carrying capacity" would actually be the total number of people infected. After all, viruses needed human hosts to remain "alive" (insofar as viruses are technically not considered alive); once there are no further non-immune hosts available, they would theoretically cease to operate- so to speak. Any physicians reading this are probably cringing at my medical terminology (or lack thereof). Back to the math....
So what is a logistic growth function?
 And right now, we are still on the first half (or leg, if you prefer) of the graph, during which dP/dT, the rate of increase, is still increasing. As of today, Coronovirus cases are increasing at a rate of 7500 per day. The "inflection point" would represent the midway point of this crisis. At that inflection point, the rate of increase would stabilize, and the daily rate of new cases would begin to decrease. You see, then, that even if today is the inflection point (which seems unlikely), we would still have another 3 weeks until the graph finally plateaued, and the total Coronavirus cases in our country maxed out at 65,000, with the virus declared contained at that point. That would appear be the best case scenario as of this point. Until we actually reach that inflection point, we would extend our estimate of the crisis' duration, as well as the maximum expected number of Coronavirus cases.
UPDATED 3/26/2020- The number of Coronavirus cases in the U.S. is now 85,268, with dP/dT of over 17,000 and climbing. We are poised to reach P of 100,000 within hours. The function now resembles an exponential function of the form P = P0r^t, where r is between 1.2 and 1.25. We are evidently not approaching an inflection point. Prepare for reported Coronavirus cases to exceed 200,000 in the best-case scenario. Worst case, we may conceivably head into 7 figures.
This happens normally, by the way- with colds, etc. We hear the expression "There's a cold going around." Within a few weeks, much of the population is infected. Why? Because normally we do not shut the country. Colds are normally of minimal danger (aside from for those with severe immune deficiencies); hence, there is no reason to stop business as usual. However, this virus is different. It is far nastier, and with a mortality rate of 4%, allowing 1/2 the population to become infected (which is a figure we hear commonly) in the absence of a shutdown, amounting to roughly 10 million American deaths, would be unacceptable to us.
We hear the expression "flattening the curve." This is precisely what is accomplished by this shutdown. Minimizing human interaction (aka “social distancing”) slows the rate of transmission so that the maximum number of Coronacases- and, more importantly, deaths resulting from such, is minimized. There is a price paid, however- increased duration. To save lives, this shutdown increases the duration before the "carrying capacity" point is reached. Hopefully we all would concur that increasing the duration is worth saving many millions of lives. Also, we hear about hospitals' capacity. By slowing the spread, this also - hopefully- decreases the cases of severe Coronavirus patients who are unable to receive adequate treatment due to shortages of beds, medical supplies, etc.
We hear many officials indicating figures of 9-11 more weeks. This is a probably fairly accurate estimate of the time remaining until containment is attained. One official grimly indicated 18 months, punctuated by multiple waves. This would make sense when considering the expectation that a vaccine to eliminate COVID-19 would likely take 18 months to develop, and meanwhile- even after containment is achieved- some people might potentially bring the virus back into our country, and it would then resume spreading to Americans not previously infected, and then another round of this. Hopefully, with our government wiser from the experience, the response would be more prompt, decisive, and hence more effective than this round.
And this, in a nutshell, is the mathematical representation of the Coronavirus pandemic. If you prefer to hear the non-mathematical details- regarding food shortages, people acting irrationally, the occasional touching story of people reaching out to help others, etc., this will pop up in front of you in today's headlines. No reason for me to provide more of this here. However, if you are reading this, please stay safe. And as Mr. Spock would say, "Live long and prosper!"
And right now, we are still on the first half (or leg, if you prefer) of the graph, during which dP/dT, the rate of increase, is still increasing. As of today, Coronovirus cases are increasing at a rate of 7500 per day. The "inflection point" would represent the midway point of this crisis. At that inflection point, the rate of increase would stabilize, and the daily rate of new cases would begin to decrease. You see, then, that even if today is the inflection point (which seems unlikely), we would still have another 3 weeks until the graph finally plateaued, and the total Coronavirus cases in our country maxed out at 65,000, with the virus declared contained at that point. That would appear be the best case scenario as of this point. Until we actually reach that inflection point, we would extend our estimate of the crisis' duration, as well as the maximum expected number of Coronavirus cases.
UPDATED 3/26/2020- The number of Coronavirus cases in the U.S. is now 85,268, with dP/dT of over 17,000 and climbing. We are poised to reach P of 100,000 within hours. The function now resembles an exponential function of the form P = P0r^t, where r is between 1.2 and 1.25. We are evidently not approaching an inflection point. Prepare for reported Coronavirus cases to exceed 200,000 in the best-case scenario. Worst case, we may conceivably head into 7 figures.
This happens normally, by the way- with colds, etc. We hear the expression "There's a cold going around." Within a few weeks, much of the population is infected. Why? Because normally we do not shut the country. Colds are normally of minimal danger (aside from for those with severe immune deficiencies); hence, there is no reason to stop business as usual. However, this virus is different. It is far nastier, and with a mortality rate of 4%, allowing 1/2 the population to become infected (which is a figure we hear commonly) in the absence of a shutdown, amounting to roughly 10 million American deaths, would be unacceptable to us.
We hear the expression "flattening the curve." This is precisely what is accomplished by this shutdown. Minimizing human interaction (aka “social distancing”) slows the rate of transmission so that the maximum number of Coronacases- and, more importantly, deaths resulting from such, is minimized. There is a price paid, however- increased duration. To save lives, this shutdown increases the duration before the "carrying capacity" point is reached. Hopefully we all would concur that increasing the duration is worth saving many millions of lives. Also, we hear about hospitals' capacity. By slowing the spread, this also - hopefully- decreases the cases of severe Coronavirus patients who are unable to receive adequate treatment due to shortages of beds, medical supplies, etc.
We hear many officials indicating figures of 9-11 more weeks. This is a probably fairly accurate estimate of the time remaining until containment is attained. One official grimly indicated 18 months, punctuated by multiple waves. This would make sense when considering the expectation that a vaccine to eliminate COVID-19 would likely take 18 months to develop, and meanwhile- even after containment is achieved- some people might potentially bring the virus back into our country, and it would then resume spreading to Americans not previously infected, and then another round of this. Hopefully, with our government wiser from the experience, the response would be more prompt, decisive, and hence more effective than this round.
And this, in a nutshell, is the mathematical representation of the Coronavirus pandemic. If you prefer to hear the non-mathematical details- regarding food shortages, people acting irrationally, the occasional touching story of people reaching out to help others, etc., this will pop up in front of you in today's headlines. No reason for me to provide more of this here. However, if you are reading this, please stay safe. And as Mr. Spock would say, "Live long and prosper!"

No comments:
Post a Comment